Understand Process Content
Process content in Stages is normally structured by separating the different dimensions of WHAT, WHO, WHEN, and HOW.
- WHAT should be done: Activities and Work Products
- WHO does it: Roles
- WHEN does it have to be done: Phases and Milestones
- HOW is it done: Guidance (Practices, Templates, Checklists, Tools, etc.)
Stages supports customizing the process meta-model (element types, names, associations), so your Stages instance might have a different structure and use a different terminology .
Understand process elements
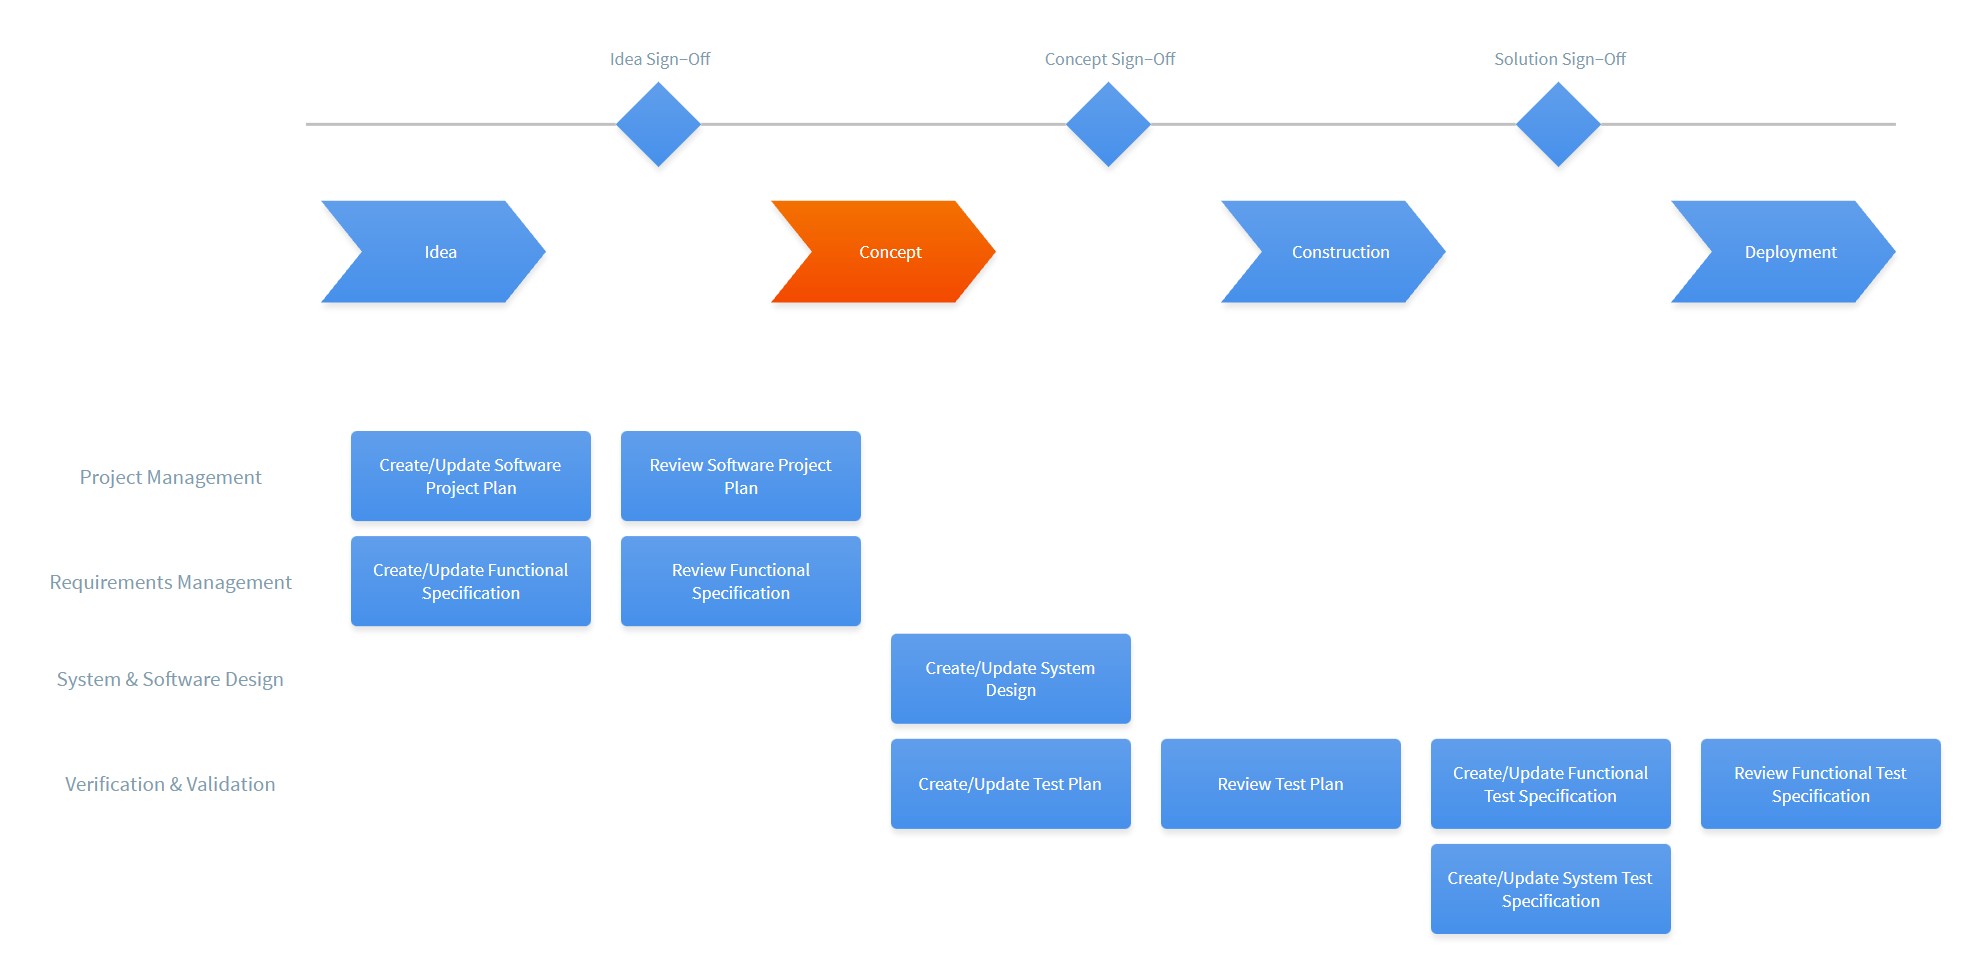
Every process has a start page that can be reached by using the Processes menu in the left-hand navigation. The start page normally contains an image showing a high-level overview of the process, e.g. a V-model diagram for a product development process.
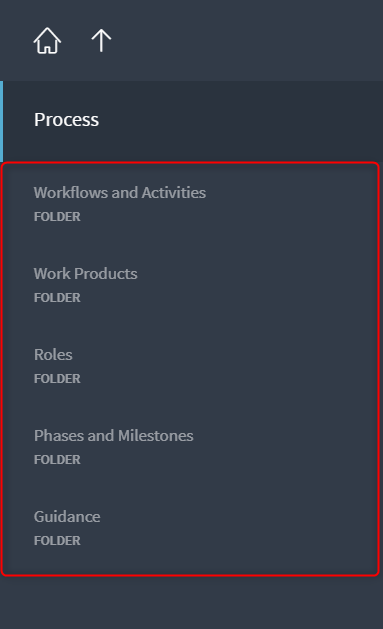
To drill down into a process, use the Activities, Work Products, Roles, Phases and Milestones, or Guidance menus. You can then drill further down by clicking or tapping in the navigation menu or in the main page showing the content.
The arrow up icon brings you one level up. You can also use the browser back and forward buttons to navigate back where you came from and forth where you already were.
Activities
The activities section contains a collection of activities and decisions that describe WHAT needs to be done in a process.
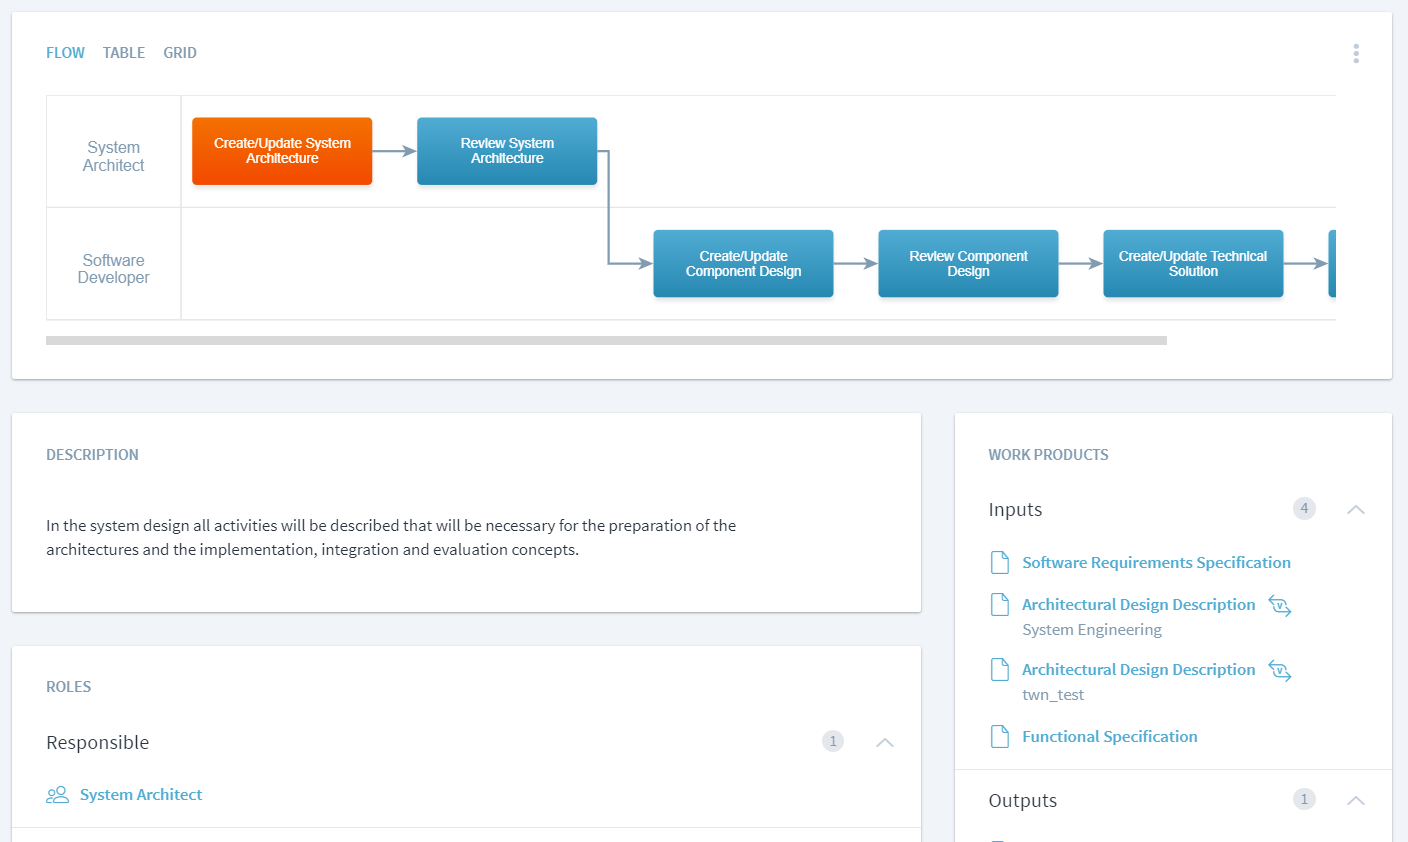
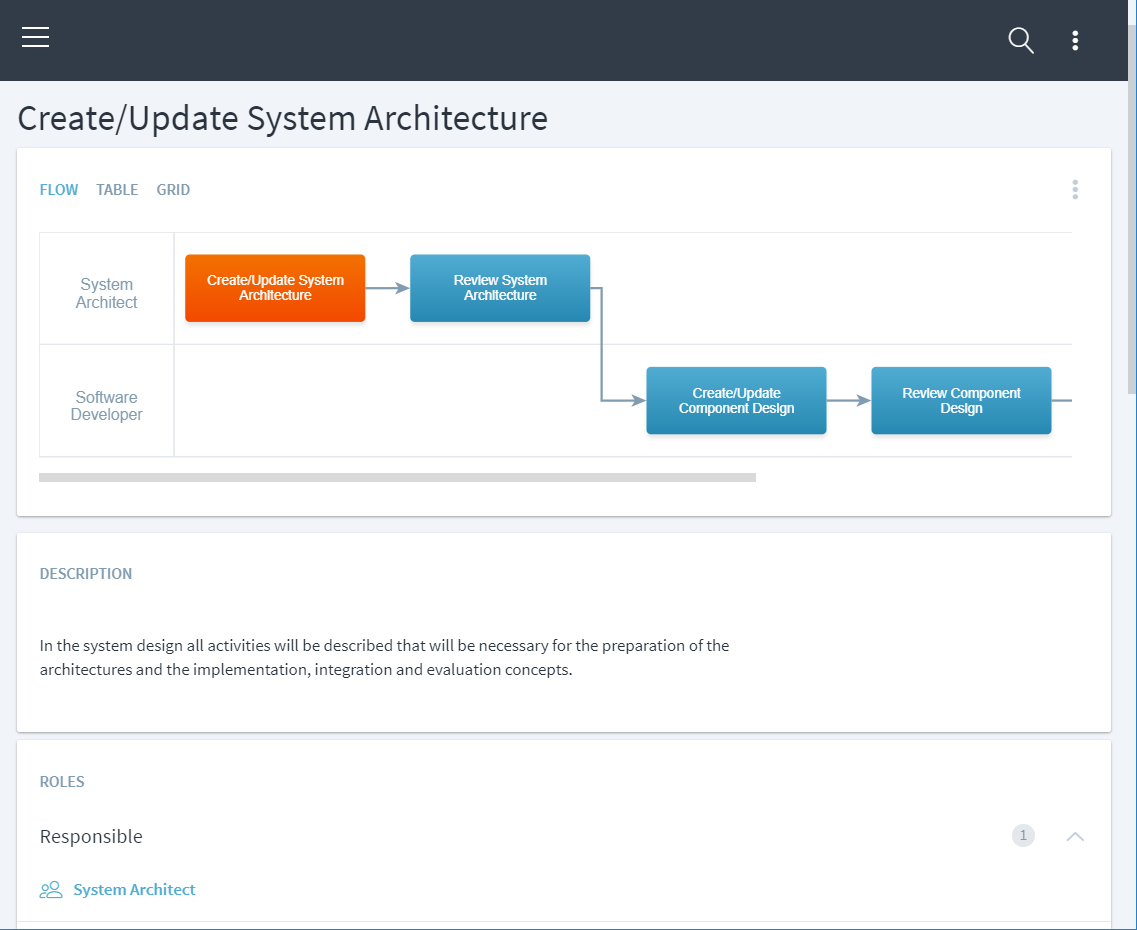
Every activity page typically contains a diagram. With the selection on top of the diagram, you can choose which diagram type best fits your information needs:
Flow
The flow diagram displays the sequence of the activities from left to right.
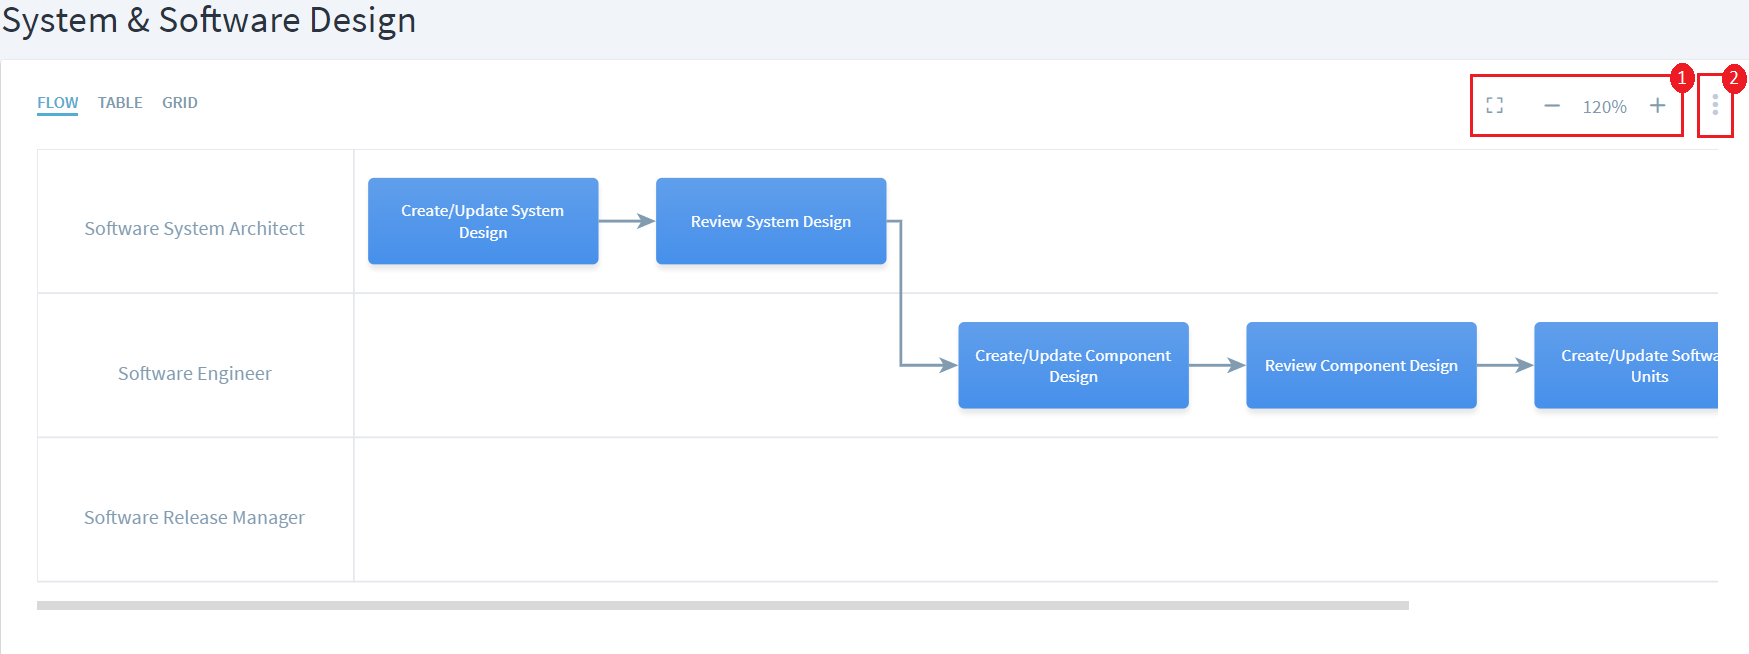 Very similar to popular products like Google Maps, users can zoom into detailed visualizations or zoom out by clicking or tapping on + or - (1) , use mouse or fingers to scroll through the diagrams via “drag”, and snap it to the whole screen size.
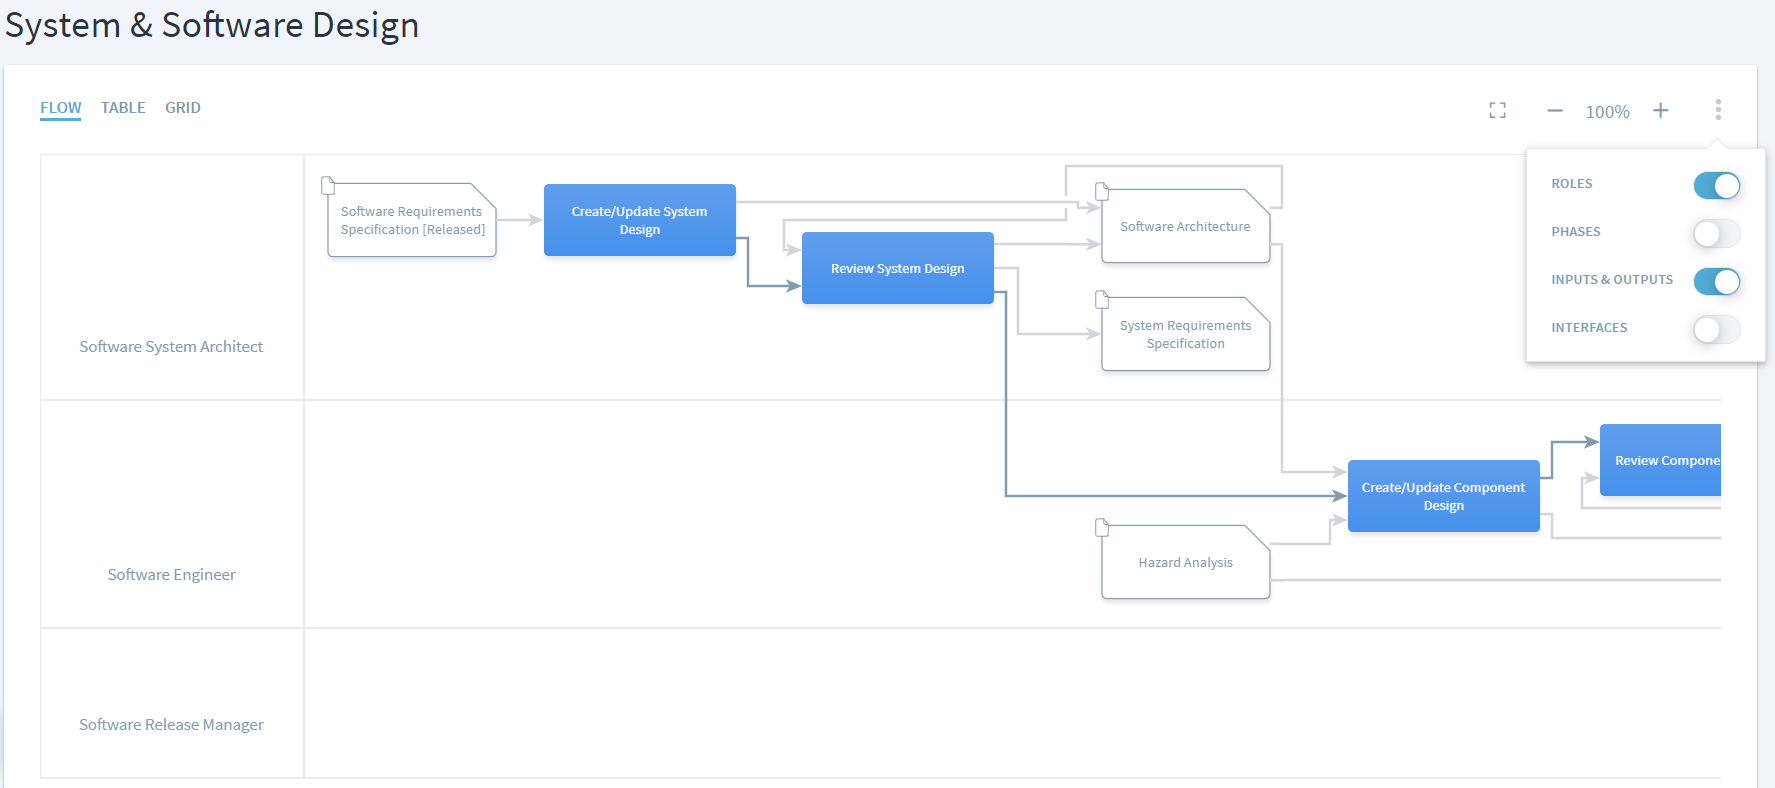
With the filter menu located at the top right of the diagram (2) you can display additional information, e.g. the input and output work products, the responsible roles, the phases, or the interfaces (= where the current activity flow consumes or produces work products from or for other flows).
Table
The table diagram is best suited to understand the dependencies of the current activity flow with other flows. The activity flow goes from the top to the bottom and per default shows the input and output work products of every activity and the activity flow producing or consuming those work products.
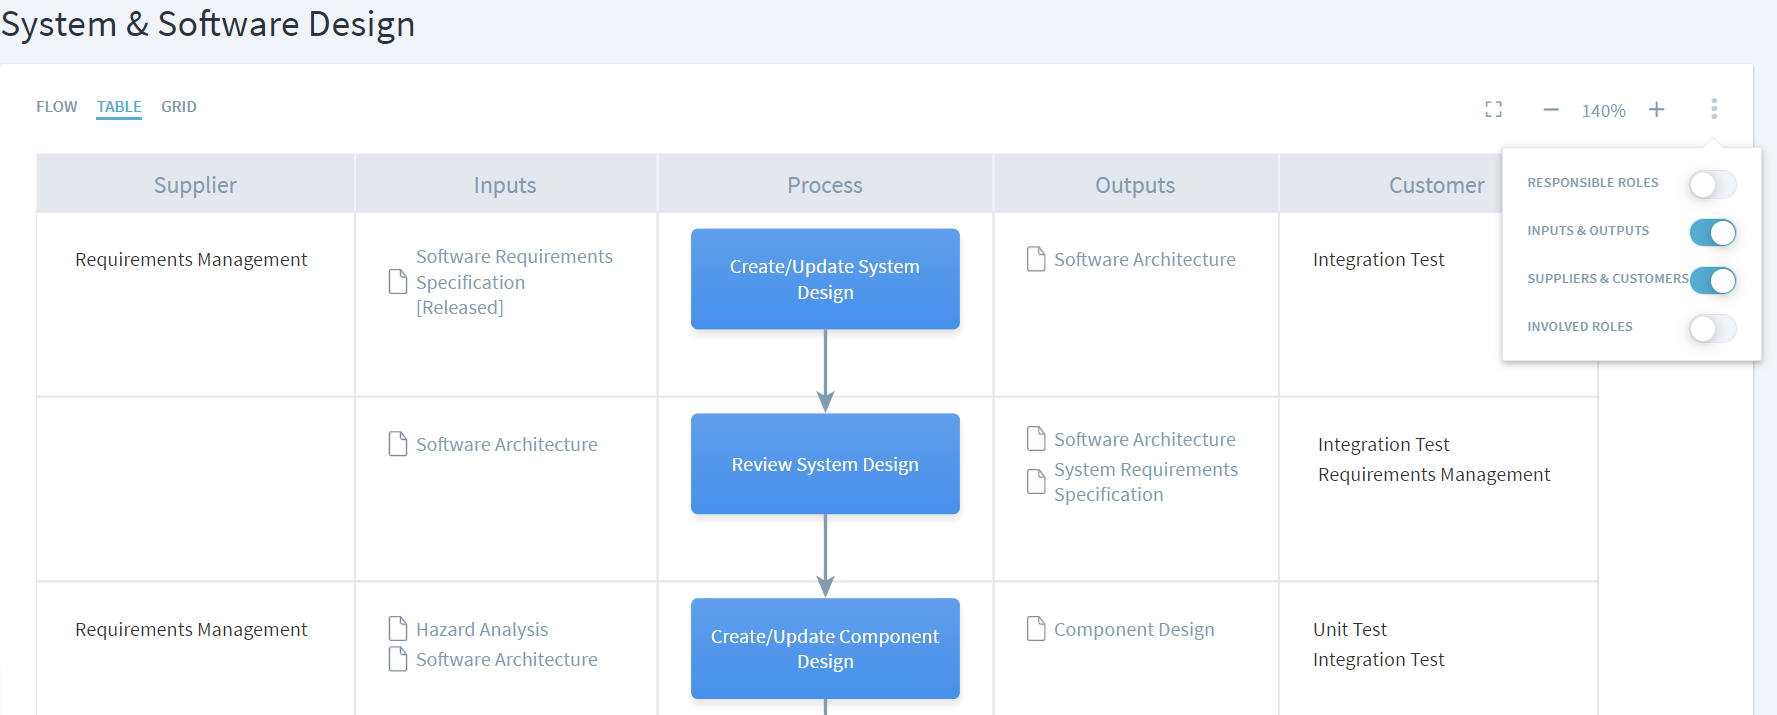 With the filter menu you can choose to display the suppliers (= producers) and customers (= consumers), the inputs and outputs, or the responsible and involved roles.
Grid
The grid view offers a very reduced visualization of the activity flow. It shows the activities in sequence, either through direct predecessor or successor activities, or through inputs and output work products.
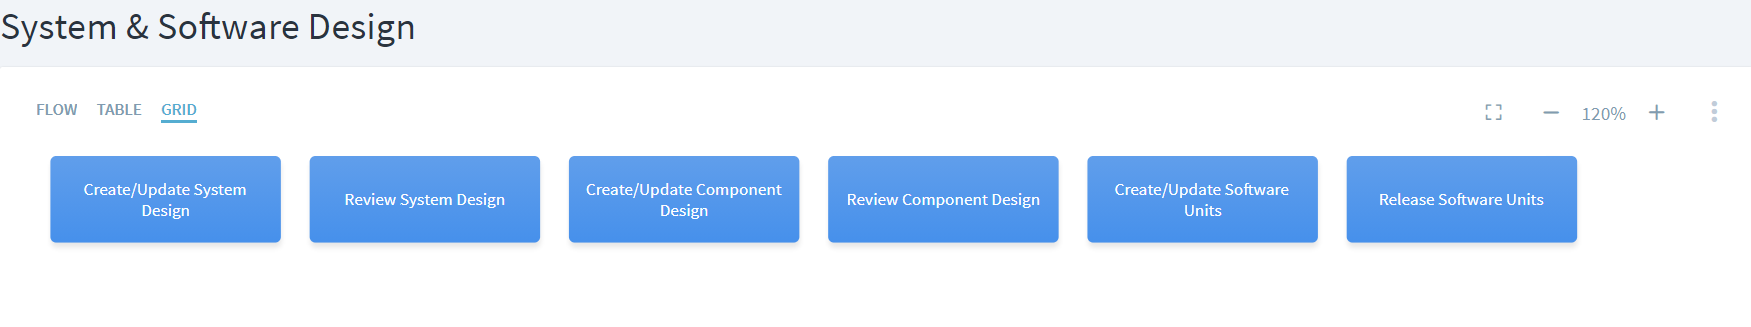
Activities that can be executed in parallel are shown in the same column.
Work Products
Work products are the inputs for and outputs of activities. They are also part of the WHAT dimension. Work products can also associated with milestones to model at which point in time certain work products need to be in a certain state.
Stages typically visualizes three different aspects of work products:
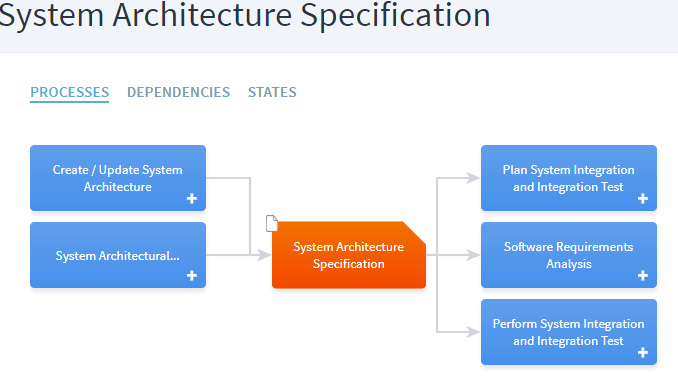
Processes
This diagram shows the processes where a work product is produced or modified in and the processes where a work product is consumed in. It provides an overview of where a work product comes from and where it goes to.
Dependencies
This diagram shows which other work products depend on the current work product and on which other work products the current work product depends on. This information is extracted from the input and output associations of activities with each other.
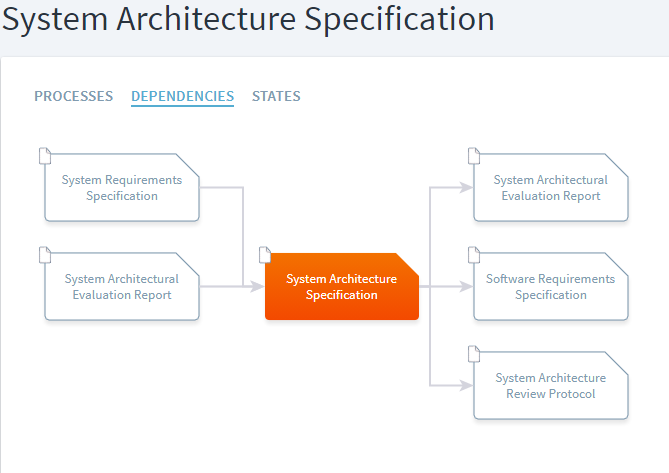
For example, if work product A is an input for an activity that has work product B as and output, work product B is shown as being dependent on A. This view is especially useful for understanding which work products need to be modified or at least inspected if a specific work product was modified during a process.
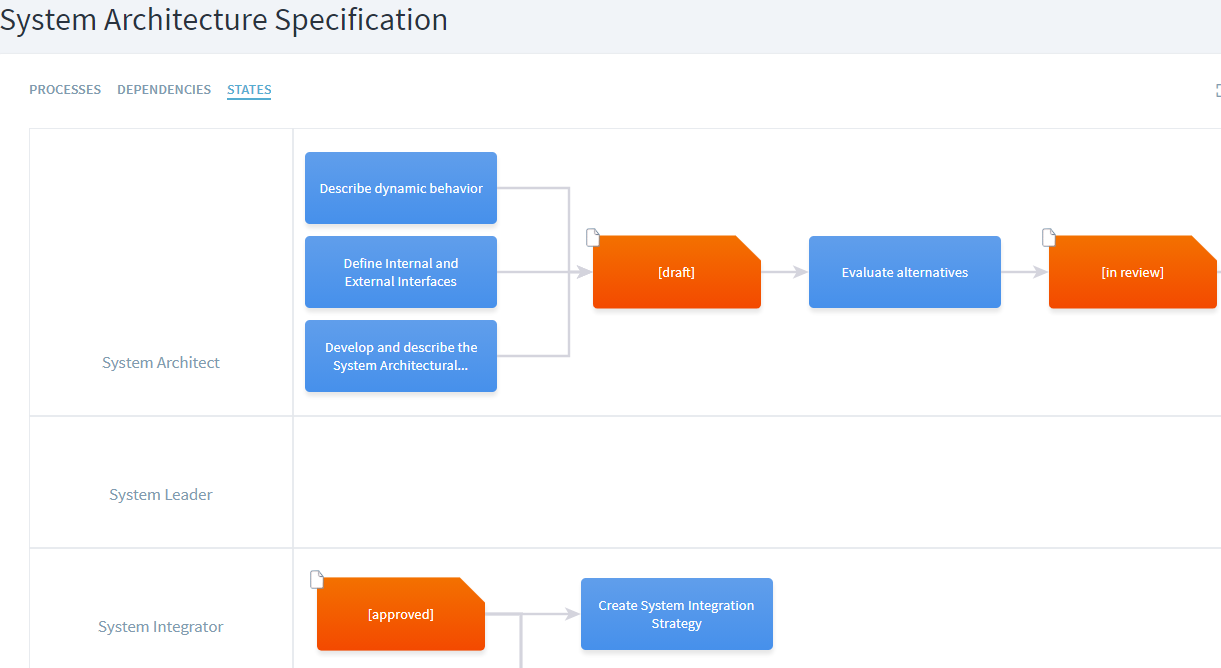
States
This diagram shows the state in which work product is consumed in activities or workflows and the state in which it is delivered at the end of the activity or a workflow.
Roles
Roles describe WHO should perform work in a process. They can be associated with activities, typically in a RASIC format: Responsible, Accountable, Supporting, Informed, Consulted.
In projects, programs, or other process instances, roles can be assigned to persons.
Phases and Milestones
Phases and milestones describe the time dimension or the WHEN of the process.
Phases are typically associated with the activities that need to be performed within a specific phase. Milestones describe when specific work products need to be in a certain state.
Guidance
The guidance describes HOW to perform the work in a process. Guidance can consist of many different elements, e.g., practices, checklists, templates, tools, training, or links to other web resources.
Supplements
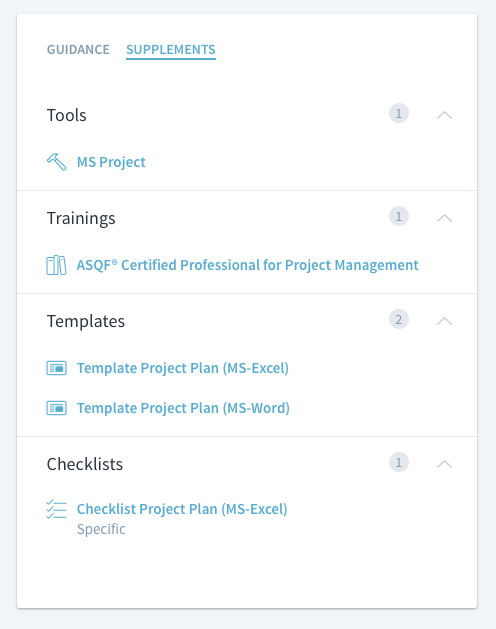
Supplements are guidance elements collected automatically from the output, parent, and child elements of an element.
Understand process element details and associations
Every process element, e.g. activity or work product, is described on one page. Every element can have a description and several associations to other elements, e.g. defining the responsible role and the input and output work products for an activity.
Depending on the size of your screen and your device you might see this information in different layouts: two columns for normal screens, three columns on wide screens, or only one column on small screens or mobile devices.
Using different perspectives
To switch your perspective, use the three icons on the top right of the screen or the “…” menu in the mobile view.
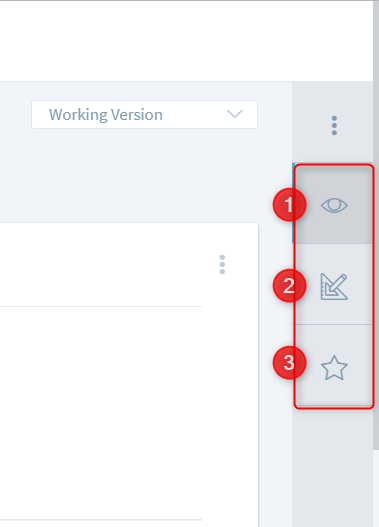
(1) Viewing: The viewing perspective is meant to be used by all users. It shows the most important information about a process element, e.g. its description, a diagram, and its associations with other elements.
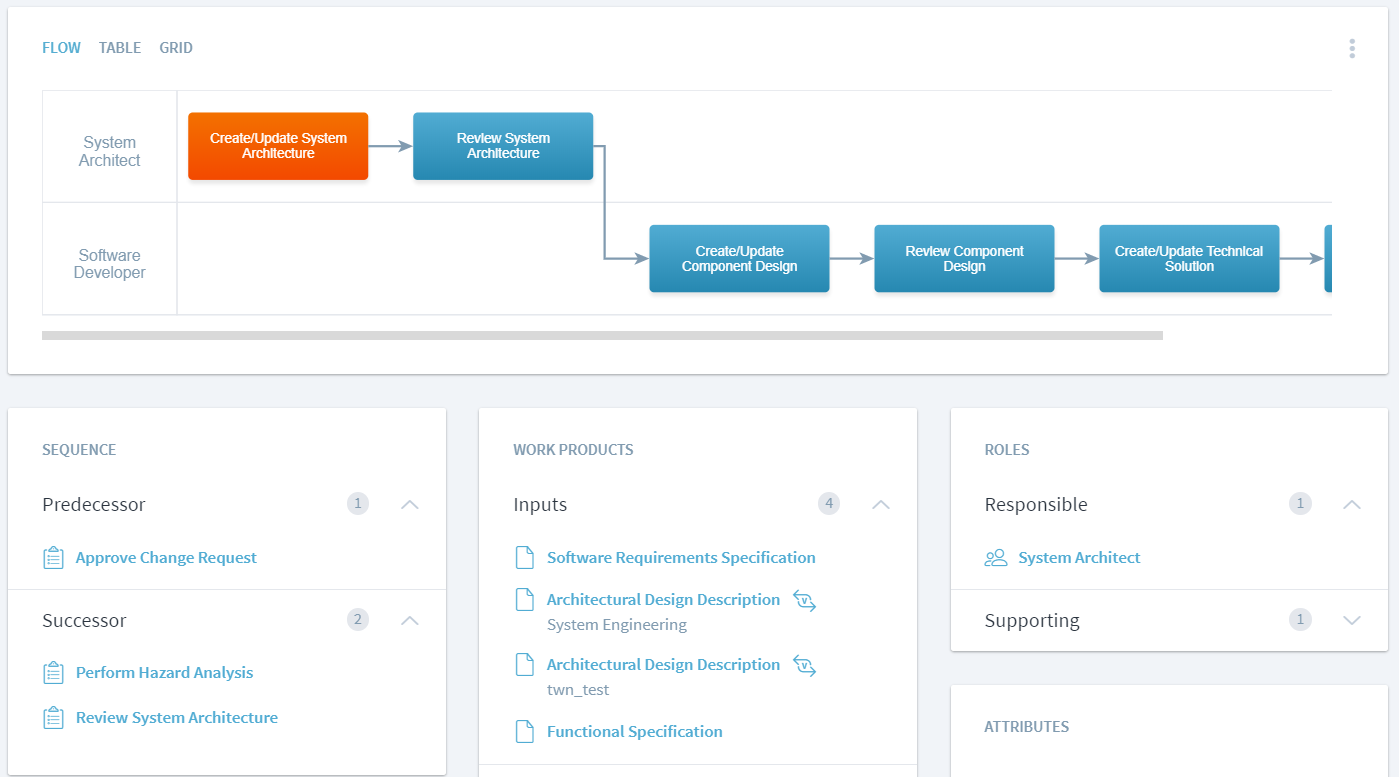
(2) Modeling: The modeling perspective is best used by process modelers when defining processes. It uses a three-column layout on large screens to ease modeling process with a minimal set of interactions. It also show additional details not shown in the viewing perspective, e.g. the activity sequence, element properties, and attributes that are only of interest for the modelers.
(3) Compliance: This perspective can be used to understand which standard requirements are satisfied with a specific activity, work product, or guidance. Typical standards are CMMI, Automotive SPICE, or ISO 9001.